| |||
| Math Central | Quandaries & Queries |
|
Attached, please find a plotted curve (pdf file). I have pulled values from this curve (see below). I need an equation that best fits these numbers. Can you help? Thanks, |
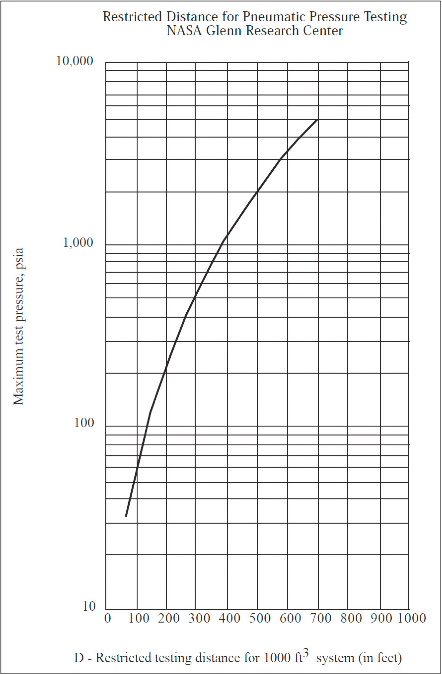
Michael,
The graph is a plot of the restricted testing distance (D) in cubic feet against the log of the absolute pounds per square inch (psia). The graph looks as it might be a piece of a quadratic curve so I suggest you try a linear regressiion of D2 against log(psia).
Harley
 |
 |
|
Math Central is supported by the University of Regina and The Pacific Institute for the Mathematical Sciences.