| |||
| Math Central | Quandaries & Queries |
|
From a histogram only, can you find the frequency per each increment of an interval? |
Hi Bea,
A histogram is actually a graph of tabulated frequencies. Along the horizontal axis is the intervals and along the vertical axis is the frequencies.
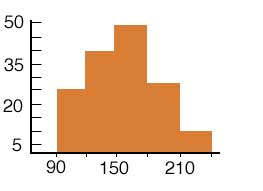
For example: In the above histogram, the interval of 90-120 has a frequency of 25.
Hope this helps,
Janice
 |
 |
|
Math Central is supported by the University of Regina and The Pacific Institute for the Mathematical Sciences.