| |||
| Math Central | Quandaries & Queries |
|
Question from Warren: If you are an ardent shopper you will be aware of the discount (% decrease) marketing strategy to produce the sale price. I began to wonder just how much mark-up (% increase) was added initially to an item in order to deliver the discounted sale price. It was simple to construct a formula to convert one to the other. For example a 30% (mark down) decrease in price required a 42.86% (mark up) to increase the price initially to Tag price. However when I started apply the formulae to a number of circumstances I noticed some very interesting circumstances associated with this relationship For example a 99.999999% decrease is numerically equal to a 9,999,999,925% increase (huge ratio difference) while conversely a 0.1% decrease is numerically equal to a 0.10010010% increase (Infinitesimally small ratio difference) so the patterns appears logarithmic not linear. However what really caught my attention was this pattern See http://www.ozsmart.com/doc/percentage.htm My questions is why does the decline in the ratio of increases in required mark up (%) price peak at 50 and 51% precisely and then expand again as the percentage move higher Any explanation would be appreciated |
Hi Warren,
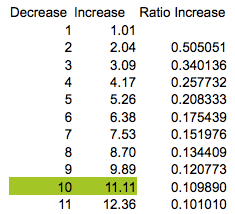
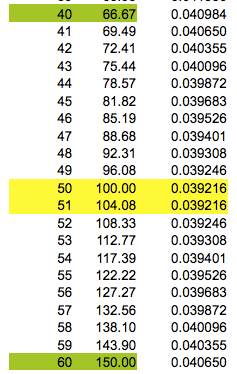
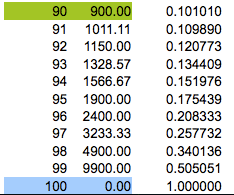
I grabbed the first few rows, the middle section and the last few rows in the table at
http://www.ozsmart.com/doc/percentage.htm
|
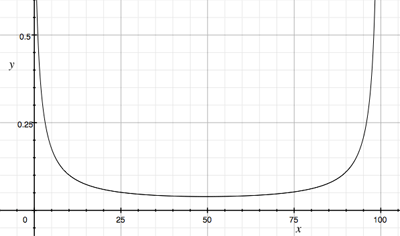
What struck me in the table was that not only did the numbers in the third column decrease to rows 50 and 51 and then increase but that the increases and decreases are symmetric. I decided to express the values in columns two and three as functions of the values in column 1 to see if that would help explain. Talking about columns 1 and 2 you say "It was simple to construct a formulae to convert one to the other." I'm not sure what expression you used but if $x$ is a number in the first column the the expression I used for the number in the same row and the second column is given by the expression $g(x) = \frac{100 x}{100 - x}.$ For the third column, what you call Ratio Increase, if the number in the first column is $x$ then the number in the third column is given by the expression $f(x) = \frac{g(x) - g(x - 1)}{g(x)}.$ Some algebraic simplification yields \[f(x) = \frac{100}{x( 101 - x)}.\] I then graphed $y = f(x)$ and you can see that the graph is symmetric with the minimum point midway between $0$ and $100,$ that is at $x = 50 \frac12$.
Harley |
 |
 |
|
Math Central is supported by the University of Regina and The Pacific Institute for the Mathematical Sciences.