
Name: James
Who is asking: Student
Level: Secondary
Question:
I'm trying to graph Systems of Conic Sections with inequalities, but I'm running
into problems on which area to shade:
x^2+y^2 is greater than or equal to 16
xy > 4
So I graph these two equations, and then my teacher said to substitute a point into it but I'm still not sure how to do it...
I would graph each inequality separately and then put the results together.
|
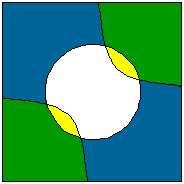
The boundary for the first inequality is a circle of radius 4, x^2 +y^2 = 16, which divides the plane into two regions, the inside of the circle and the outside. Take some point inside the circle, for example (0,0) and notice that it does not satisfy the inequality. However every point outside the circle, for example (5,5), does satisfy the inequality. Hence shade with blue the portion of the plane that is outside the circle. | |
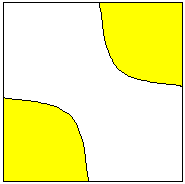
Now plot the boundary of the second inequality, xy=4, and see that it separated the plane into three regions. Again check a point in each region, for example (0,0) does not satisfy the inequality, and shade with yellow the regions that satisfy the inequality. | |
Now plot both boundary equations and look for the regions that satisfy both inequalities, that is the green regions that got shaded in both of the previous steps. |
Cheers
Penny
To return to the previous page use your browser's back button.